Event analytics dashboard

See registration, attendance, revenue, and app activity in the views your event team uses

Follow the event from demand to arrival and attendee app use with focused dashboards built from EventHex registration, ticketing, check-in, and app data.

Monitor registrationOperate arrivalsUnderstand app use
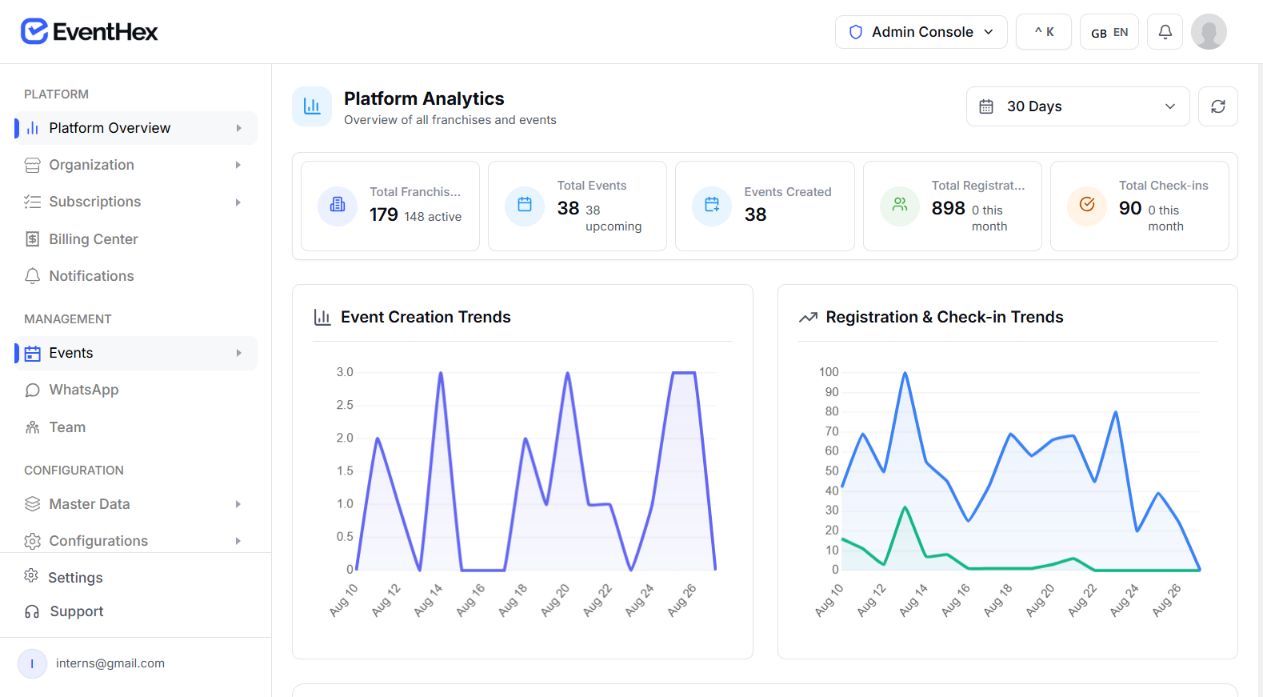
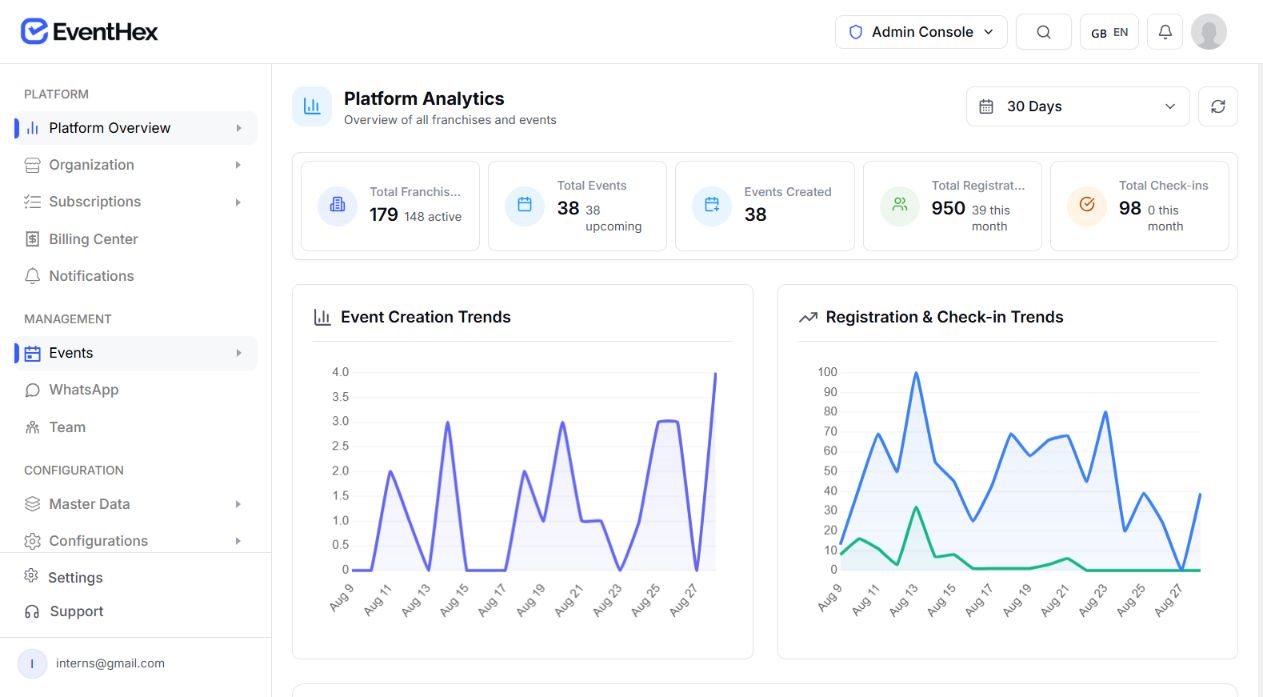
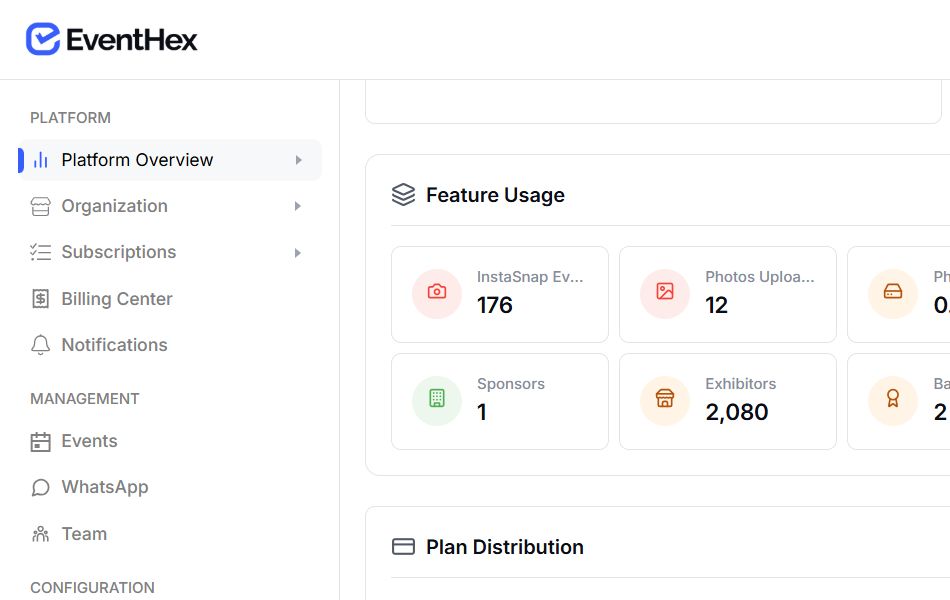
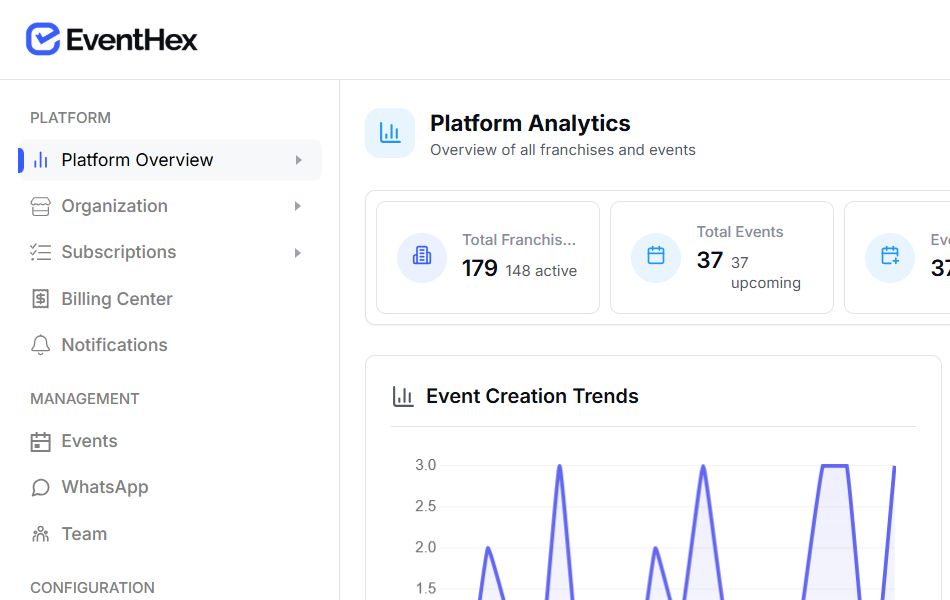
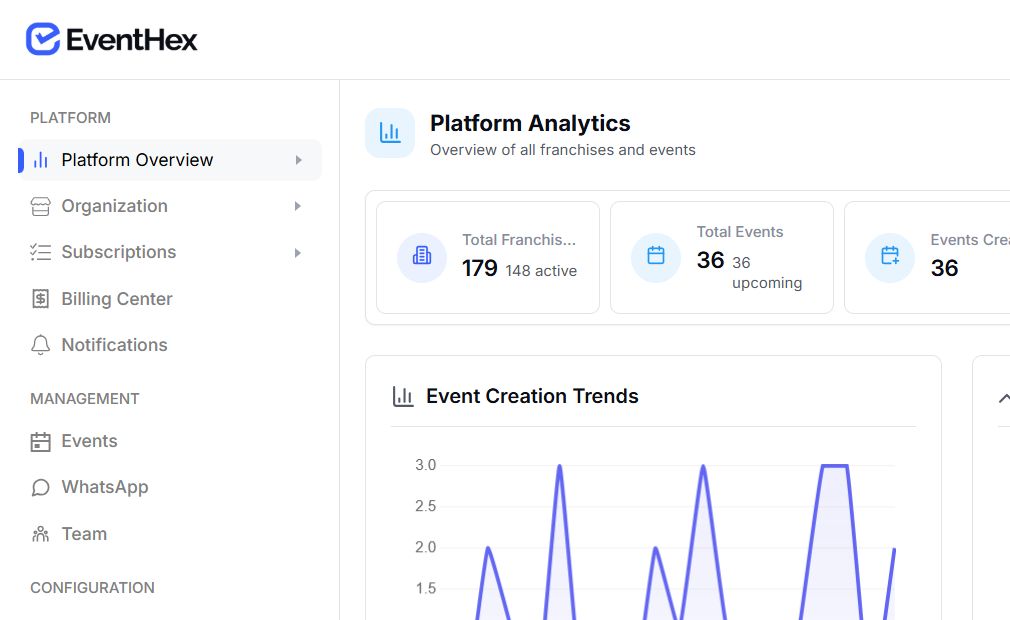
EventHex platform analytics dashboard overview
Dashboard connectedCurrent event view
A connected event view

Move from registration demand to event-day behaviour

  1. 01 Register People + tickets
  2. 02 Collect Profile answers
  3. 03 Transact Ticket revenue
  4. 04 Check in Attendance state
  5. 05 Use app Audience + screens
  6. 06 Review Trends + lists
Focused dashboards

See the operational question and the supporting view together

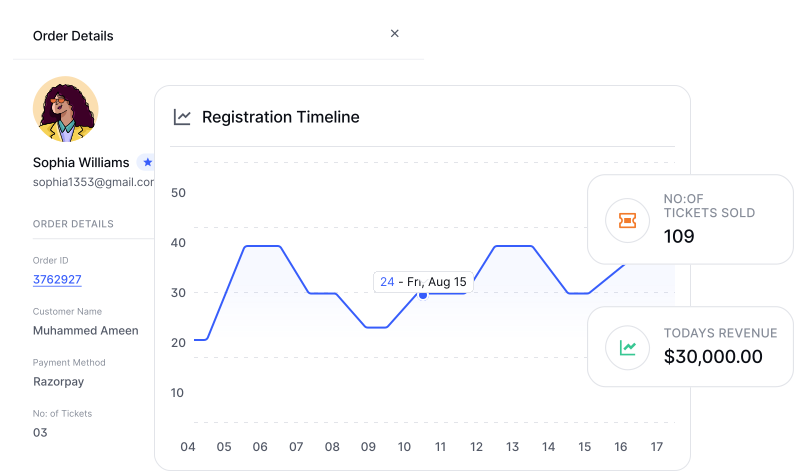
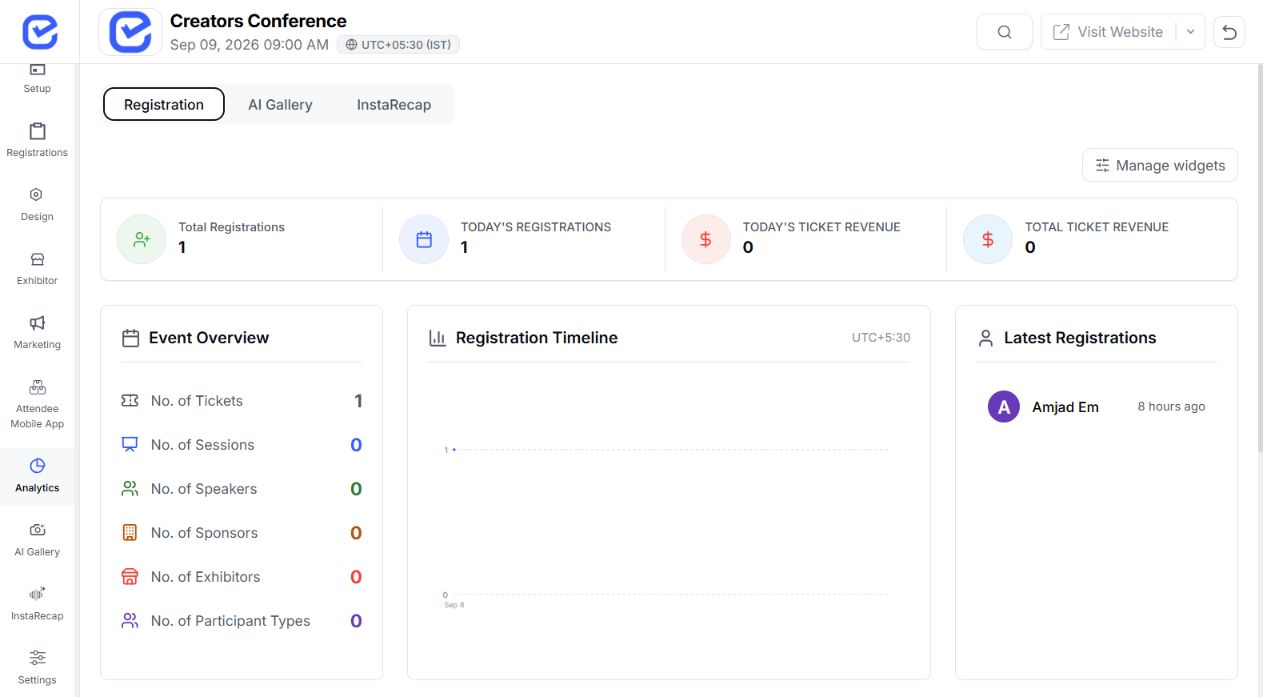
EventHex registration analytics dashboard showing registration totals and trendsRegistration analyticsView details →
01 · Registration analytics

Track volume, timing, ticket mix, and recent registrants together

Use the registration view to understand how demand is building for the selected event.

  • Registration totals
  • Timeline
  • Ticket mix
  • Peak hour
  • Recent registrations
  • Event overview
EventHex attendee analytics dashboard used to monitor event-day activityEvent-day attendanceView details →
02 · Event-day attendance

Watch check-in volume, rate, timing, and ticket mix

Switch to the attendance view when arrivals begin and the event team needs operational signals.

  • Registered vs checked in
  • Pending attendees
  • Check-in rate
  • Check-in timeline
  • By-ticket views
  • Recent check-ins
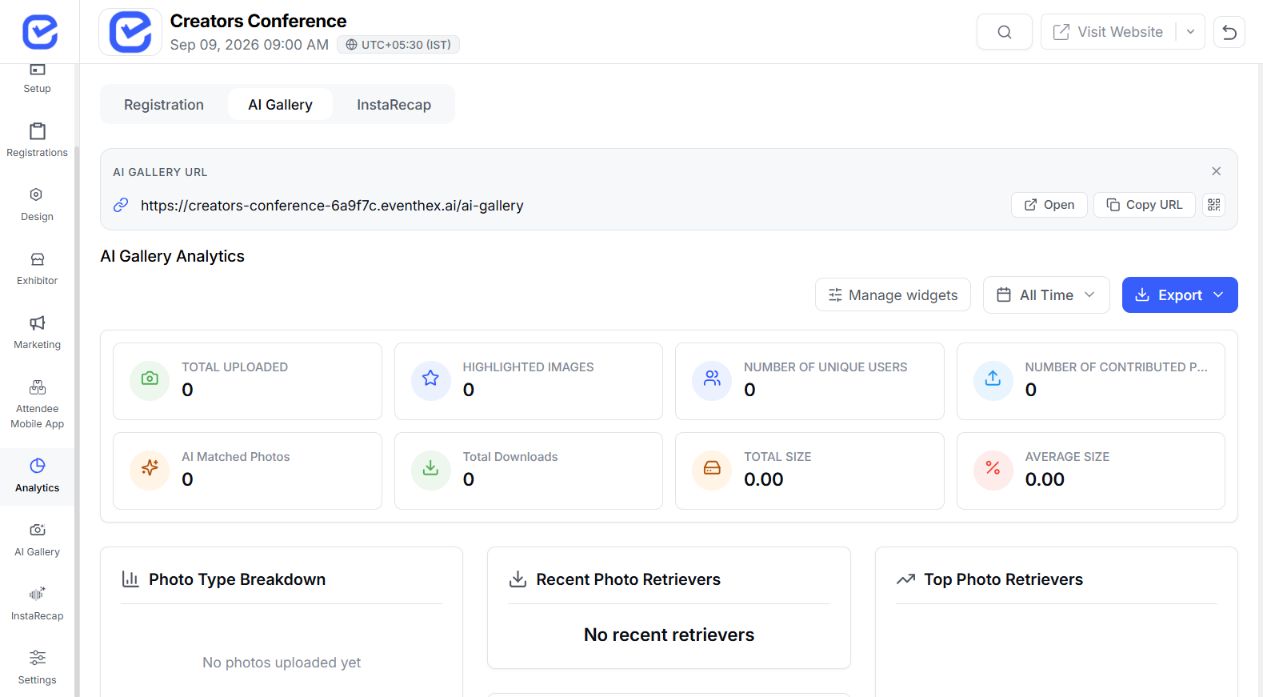
EventHex analytics dashboard with configurable audience charts and event filtersAudience compositionView details →
03 · Audience composition

Turn selected registration answers into configurable dashboard charts

Use categorical registration fields to understand who registered or checked in, with ticket filters where supported.

  • Choose fields
  • Reorder widgets
  • Change chart type
  • Filter by ticket
  • Compare scopes
  • Keep the denominator visible
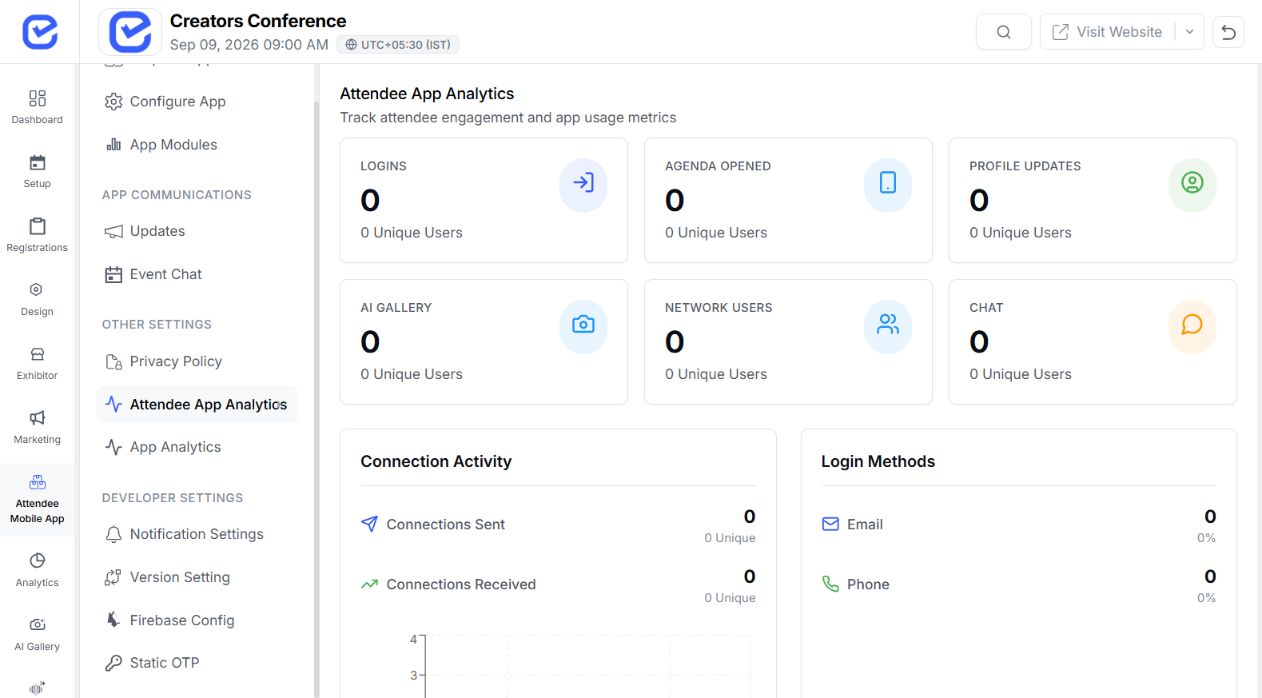
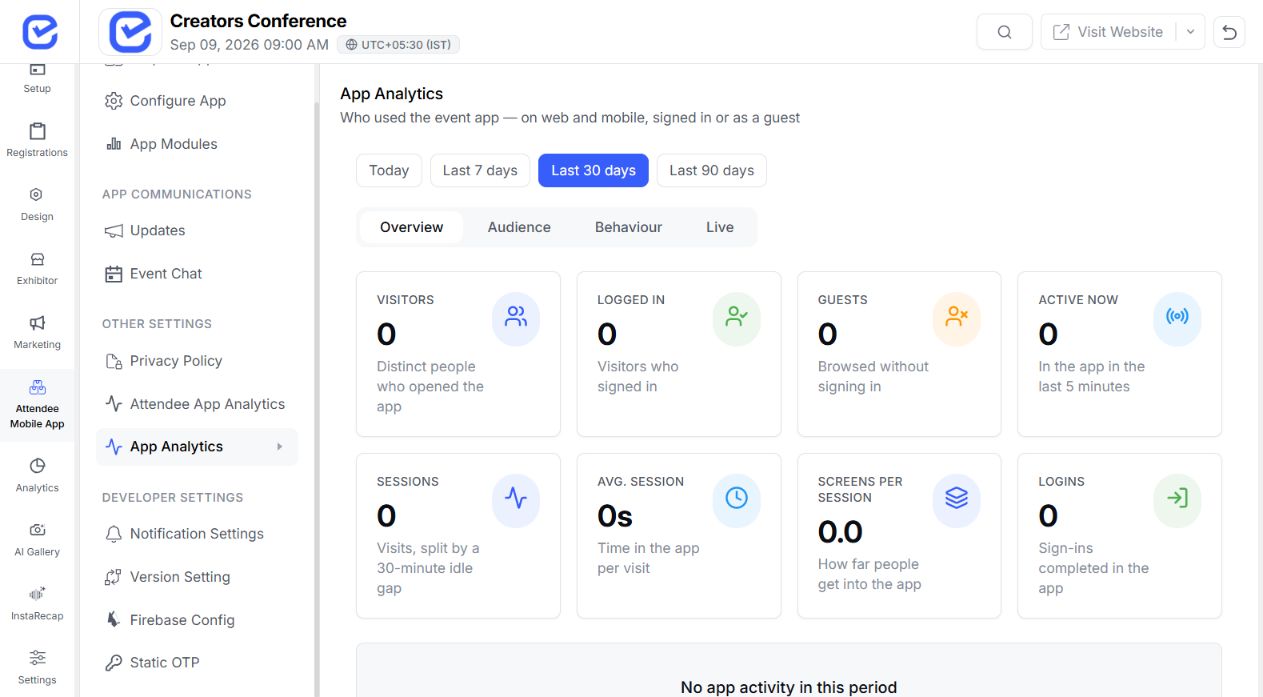
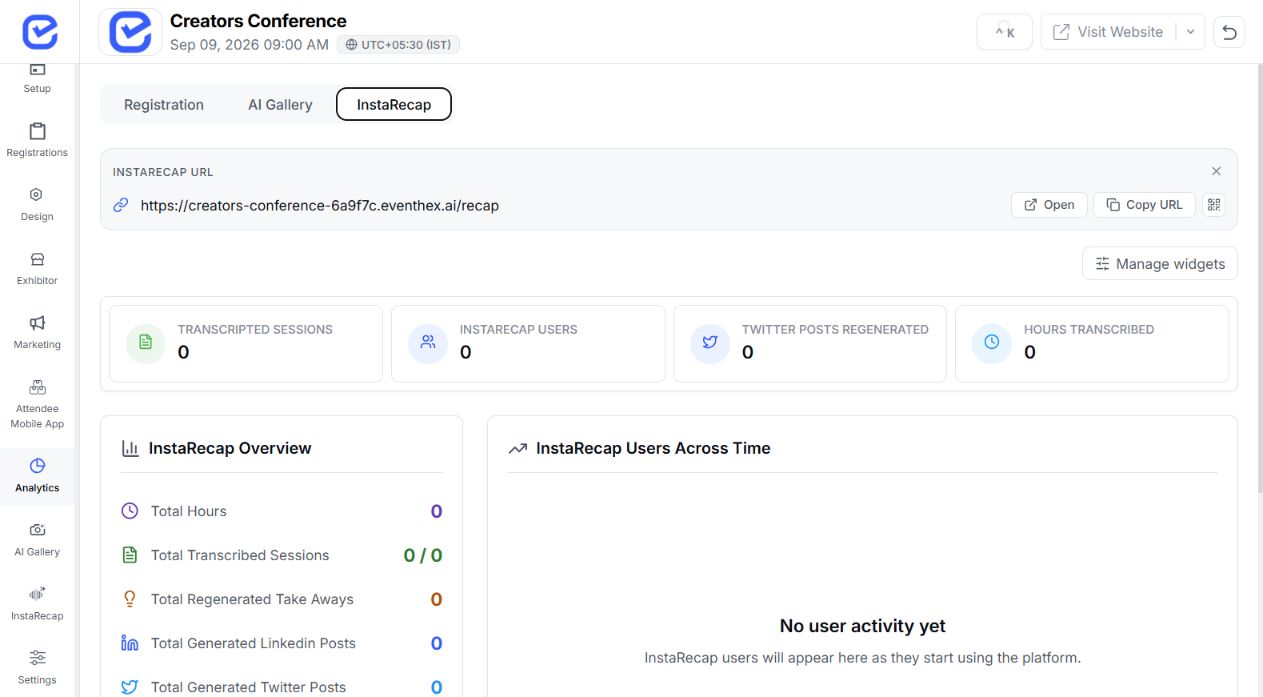
EventHex mobile app analytics showing audience and screen activityEvent app analyticsView details →
04 · Event app analytics

Understand who opened the app and which screens they used

Review the selected period across Overview, Audience, Behaviour, and Live views.

  • Reach and access
  • Session depth
  • Audience breakdowns
  • Screen use
  • Return behaviour
  • Live activity
Move from chart to detail

Inspect app sessions and export the current session list

The App Analytics audience view provides session-level rows and a CSV export for the selected period and audience filter.

Book a Demo
01

Choose the period

Today, 7, 30, or 90 days.

App analytics period controls✓ Period selectedApply range
02

Choose the audience

Review all, signed-in, or guest sessions where supported.

App analytics audience filters✓ Audience filteredView sessions
03

Inspect session context

Use platform, duration, screen count, and entry or exit information.

Detailed app session analytics✓ Session selectedInspect details
04

Export CSV

Download the current app-session dataset for further analysis.

Analytics report ready for export✓ Report readyExport CSV

Match the Dashboard Refresh Pattern
to the Operational Question

Different views use different query freshness and aggregation paths, so confirm the last refresh before treating a number as current.

Event dashboard

Operationally current

Registration, overview, and attendance queries use cached client requests with different stale times and manual refetch support.

EventHex event dashboard analytics overview✓ Dashboard viewRefresh when needed
EventHex app live analytics view✓ Live tab openPolls every 15 seconds
App live view

Near-live polling

The organizer screen polls its live analytics endpoint every 15 seconds while the Live tab is open.

Read each metric honestly

Use the dashboard signal without turning it into an unsupported conclusion

01 · Metric boundary

Screen view ≠ session attendance

Opening a session screen does not prove physical attendance or content completion.

Explore reports
Session recap analytics view
02 · Metric boundary

Ticket revenue ≠ settled payout

Refunds, tax, fees, and settlement require finance workflows.

Explore reports
Event revenue reporting interface
03 · Metric boundary

Check-in ≠ engagement

Arrival state does not measure satisfaction or participation.

Explore reports
Attendee engagement analytics view
04 · Metric boundary

Sponsor visibility ≠ sponsor ROI

ROI requires agreed value and attributable sponsor outcomes.

Explore reports
Event gallery analytics view
05 · Metric boundary

Guest conversion ≠ ticket conversion

The app funnel measures app sign-in behaviour.

Explore reports
Event app analytics overview
06 · Metric boundary

Trend ≠ forecast

Historical movement does not guarantee future registrations or attendance.

Explore reports
Event analytics insights view

Keep Registration Volume and Ticket Value in the Same Operating View

The event dashboard surfaces today’s ticket revenue and total ticket revenue beside registration counts.

Monitor paid ticket activity

See whether paid ticket activity is changing while monitoring registrations.

INCLUDES
  • ✓ Today’s ticket revenue
  • ✓ Total ticket revenue
  • ✓ Registration volume
EventHex ticket revenue reportingRevenue view
Quick Answers

Event Analytics
Questions, Answered.

Find quick answers about registration, attendance, revenue, event-app activity, and reporting.

Visit Help Center
What can the main event dashboard track?

Verified views cover registration totals and trends, ticket revenue totals, attendance counts and rates, ticket breakdowns, recent activity, repeat attendance, and selected registration-field distributions.

Can we analyze registration fields?

Yes. Supported categorical fields can become configurable charts with visibility, order, chart type, answered count, and optional ticket filtering.

What does app analytics include?

It includes visitor and session summaries, audience breakdowns, screens and feature use, guest funnel, retention, live activity, and a filtered app-session list.

Is every metric real time?

No blanket real-time claim should be made. Event dashboard queries have view-specific caching, while the app Live tab polls its endpoint every 15 seconds.

Can we export reports?

The reviewed App Analytics session list has a CSV export. A universal custom report builder or export for every dashboard was not verified.

Does EventHex calculate sponsor ROI?

The reviewed route evidence does not establish a sponsor ROI report. Use exhibitor or sponsor-specific evidence and an agreed attribution model before making that claim.